The Fixlet Debugger
The Fixlet Debugger is a graphical-based language tool that helps you test and debug your client relevance expressions and action scripts. Use it to fine-tune your relevance expressions and action scripts before deploying them to your production environment.
The Fixlet Debugger is available only on Windows platforms. It must be run by a Windows user with local admin privileges.
The tool is installed automatically with the BigFix Console and, during the installation, a shortcut is automatically added in the Windows start menu. You can also download a stand-alone version of the Fixlet Debugger.
Note: Ensure that both the Fixlet Debugger and the BigFix Client installed on the same system have the same version.
How to run the tool
The Fixlet Debugger user interface includes four tabs:
- The qna tab
- Where you can enter your queries, preceded by Q:, and evaluate them all again whenever you click the Evaluate button.
If the expression evaluates successfully, an answer to your query is displayed as an A: followed by the result of the expression. If an error occurs when evaluating the expression, or if the result does not exist on the current system, the result is an E: followed by the appropriate error message. All other lines are passed through unchanged. You can also obtain the number of microseconds it takes to calculate each relevance expression (T:). After every evaluation, all existing lines that begin with A:, E:, or T: are removed before processing the next query.
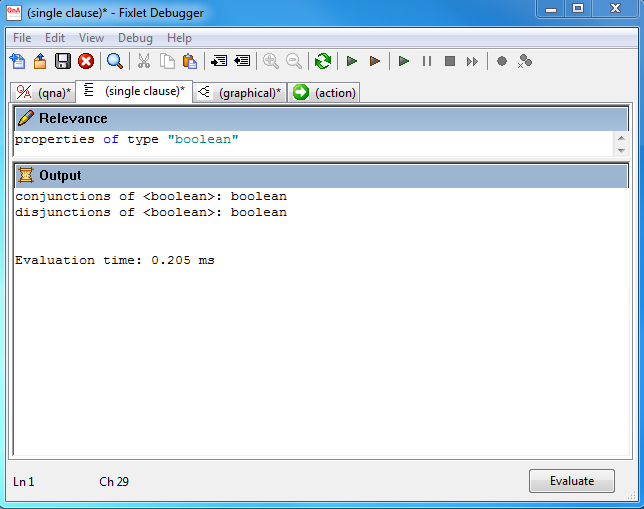
- The single clause tab
- Where you can enter and evaluate one query at a time. There is no need, in this case, to write Q:. Obtain detailed error information
- The graphical tab
- Where the result of your query is split to display the evaluation of each single inspector involved in the query.
- The action tab
- Where you can test your action script on the local system.
For more information about this tool, view the following video.
How to run queries against remote targets using Query Channel
You can use the Fixlet Debugger to run relevance statements and see their results, on one remote endpoint at a time. The BigFix Agent running on the remote endpoint must be v9.5 or later.
Follow these steps to run a relevance statement on the remote target:
- Enter the Query Channel mode:
- To query by using QnA, click Evaluate > Evaluate Using > Query Channel using QnA.
- To query in client context, click Evaluate > Evaluate Using > Query Channel using Client.
- In the login window opened by the Fixlet Debugger, enter the credentials to connect to a BigFix environment. Ensure that the specified user has both the Can use WebUI and the Can Submit Queries permissions set to YES to run the query on the remote target.
- After having logged in successfully, you can select the computer ID or computer name of the target where you want to run the query.
When the Query Channel session is active, you can switch between using QnA and using Client. However, you have to enter the correct computer ID or computer name of the target every time you switch.
Your Query Channel session will be invalidated by the server after 5 minutes of inactivity. If this happens, Fixlet Debugger prompts you to authenticate again. You can change the timeout by customizing the _BESDataServer_APIAuthenticationTimeoutMinutes setting on the server machine.
From now on you can run queries on the selected target and see the results as if you were running the queries on your local system.
To exit the query channel mode, click Evaluate > Logout.
Registry settings
To enable debug logging on the Fixlet Debugger, make the registry settings as follows:
- HKCU\Software\Bigfix\FixletDebugger
- DebugOut - REG_SZ - Specify the full path to the log file.
- EnableLogging - DWORD - Set to 0 for disabling or 1 for enabling.
- EnabledLogs - Reg_SZ - Set to "all".
- HKCU\Software\Bigfix\FixletDebugger
Similar to the BES Console, Fixlet Debugger also stores a list of hostnames and its usernames at HKCU\Software\Bigfix\FixletDebugger\Server.