The Presentation Debugger
The Presentation Debugger tool allows you to create and debug Session Relevance expressions.
You can access the Presentation Debugger tool from the optional Debug menu on the BigFix Console. Run these steps on the BigFix Console to display the Debug menu and open the Presentation Debugger:
- While the BigFix Console is running, press Ctrl-Shift-Alt-D to display the Debug window.
- Click the check box next to Show Debug Menu at the top of the window. This installs a new menu in the Console called Debug that contains several handy debugging tools.
- From the Debug menu, click Presentation Debugger to open the Presentation Debugger window.
Alternatively, you can edit the registry:
- Locate the key HKCU\Software\BigFix\Enterprise Console\NoEditMenus.
- Set the DWORD value Show Debug Menu to 1.
- Restart the console.
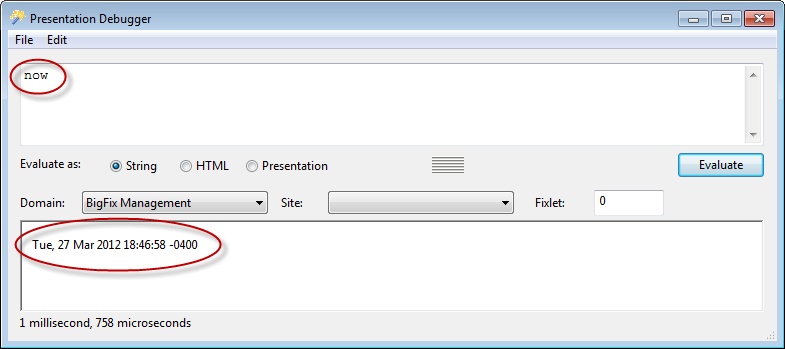
You can access the Presentation Debugger whenever you create a new or custom Fixlet, task, baseline, or analysis. In the description tag, enter the text, and then from the toolbar at the top, insert the Wizard Hat icon to display the Presentation Debugger dialog. The dialog box contains a text box at the top, where you can type in your Relevance expressions or copy and paste the expressions from any examples to see the result.
Some buttons are attached to this dialog, although they differ depending on the context of the dialog:
- Cancel: Available when the debugger is called from a wizard tool, use this button to cancel the insertion of the wizard.
- Insert: Also available when the debugger is called from a wizard tool, this button lets you insert the wizard icon into a custom Fixlet, task, baseline, or analysis.
- Open File: Opens a File Open dialog to import an existing Relevance statement or a dashboard-style file.
- Evaluate: Click this button to evaluate the specified Relevance statement. The results are displayed in the box below. You can evaluate the expression as a string, HTML, or a Presentation.
You can also attach a site (from the pull-down menu) and a Fixlet ID to your expression, by using the appropriate input boxes.
Best Practices
Although the Presentation Debugger works well for a few lines, it is inefficient for significant development projects. Every time you make a change using the Presentation Debugger, you must re-import it, creating a new copy of the session relevance implementation, for example, an analysis. So, during extensive debugging, you might have multiple copies of the same analysis making it difficult to keep track of the latest version and possibly loading the clients with superfluous analysis evaluation.
You might want to follow this guideline to prevent this inconvenience when developing and debugging your session relevance implementations:
- Develop iteratively, a short section at a time. Use the Presentation Debugger for each short section, rather than the whole presentation, and combine the sections after debugging.
- Put the content in a Fixlet site and subscribe to it. In this way the replacement with the new content occurs automatically.
- Select Web Reports > Create Report > Advanced: Blank Report to create, edit, and view your implementation, for example a dashboard, as a Web Report.
- Create a Document Wizard .ojo file on your local drive, and then select Debug > Load Wizard to load and view it. The file will be reloaded each time you close and reopen the document.