Exposed Metrics
Starting from 11.0.4, the BigFix Platform is able to collect and expose metric information.
BigFix components exposing the collected metrics
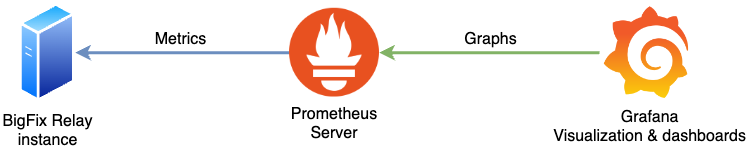
In Bigfix Version 11.0.4, the BigFix Relay is able to expose metrics related to its HTTP server operations and lets you use tools like Prometheus to collect them. The collected data can then be viewed and analyzed by a visualization application such as Grafana.
Prometheus is an open source monitoring and alerting platform that collects and stores metrics as time-series data.
Grafana is an open source analytics and interactive visualization web application.
The collected metrics are exposed by the BigFix Relay using a new REST API /metrics in a format which is supported by Prometheus. The format guidelines followed by the BigFix Relay are described in Open Metrics standard and in Text-based format.
The following image shows how Prometheus and Grafana interact with the BigFix Relay in a sample environment to provide this additional functionality.